Are Outdated Flood Zone Maps Leaving Insureds at Risk?
August 19, 2025 — Disaster insights | Insurance insights
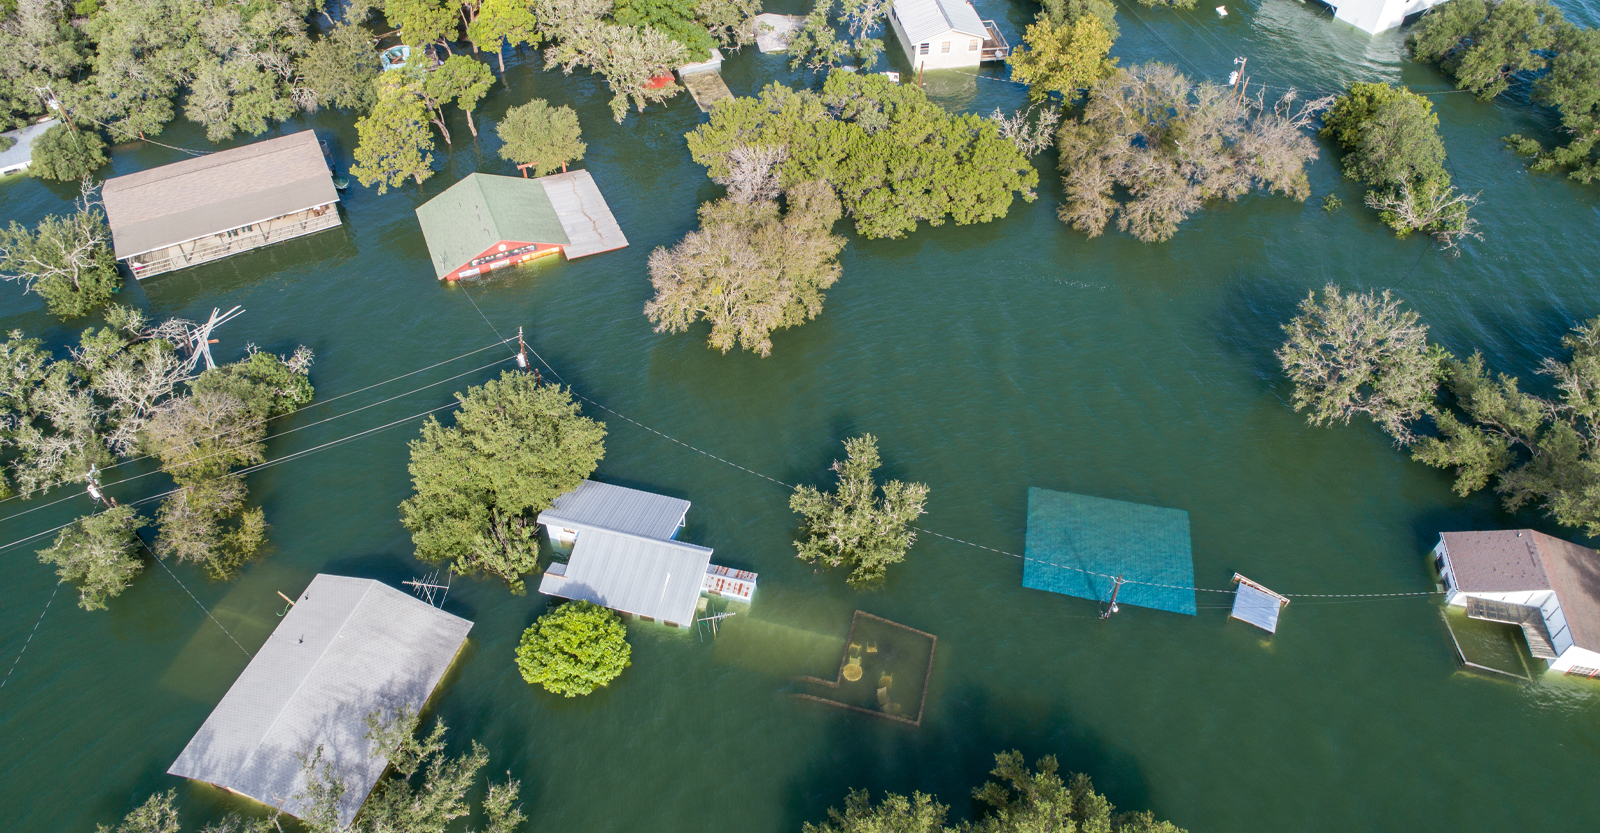
Accurate flood prediction plays a vital role in shaping insurance solutions. Flood coverage, typically excluded from standard homeowners policies, is a critical part of comprehensive property protection. Evolving climate dynamics, urban expansion, fueled by population growth, industrialization, and the loss of wetlands to naturally absorb water, and more intense rainfall have all increased the risk and cost of flooding.
Flooding is not exclusively a coastal problem either—99% of US counties have been affected by flooding. The staggering threat of flood and the occurrence of more recent flash flooding underscores a pressing need for insurance solutions.
FEMA flood maps have been used for decades to assess flood risk, determine coverage requirements, and set premiums on location-specific flood hazards. But outdated flood zone maps don’t account for the ways changing climate is impacting how and where floods happen. And without reliable data, many homeowners may not be aware of their real risk and the coverage they need to address it.
What Are Flood Zone Maps?
A flood zone map, also known as a floodplain map or flood hazard map, is a visual representation of areas that are at risk of flooding under certain conditions. They were first produced by the National Flood Insurance Program (NFIP) in 1968 to help reduce flood damage and protect property owners. This federal program is managed by the FEMA and maintains the responsibility for producing flood zone maps.
In addition to features like highways, lakes, railroads, streams, and other waterways, these maps depict floodplain boundaries, base flood elevations, floodways, and flood hazard zones.
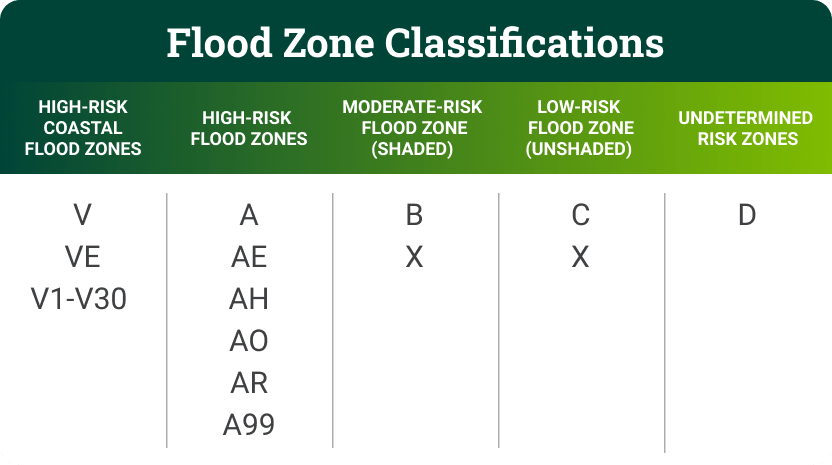
On flood zone maps, FEMA uses flood zone classifications of high, moderate, and low risk to show how likely an area is to flood.
High-Risk Flood Zones
These areas are identified as Special Flood Hazard Areas (SFHA) and have a 1% chance of flooding each year. Flood insurance is required by federally backed mortgage companies.
These zones are designated as: Flood Zone A, Flood Zone AO, Flood Zone AH, Flood Zones A1-A30, Flood Zone AE, Flood Zone A99, Flood Zone AR, Flood Zone AR/AE, Flood Zone AR/AO, Flood Zone AR/A1-A30, Flood Zone AR/A, Flood Zone V, Flood Zone VE, and Flood Zones V1-V30.
Moderate- to Low-Risk Flood Zones
Flood insurance is optional but recommended. These zones are designated as Flood Zone X, Flood Zone B, and Flood Zone C.
Undetermined Risk Zones
There is no insurance recommendation because the flood risk is unknown. These zones are designated as Flood Zone D.
Flood zone maps historically served as a valuable tool for property owners, insurance carriers, and lenders to assess flood insurance needs and calculate policy expenses.
Flood Zone Map Limitations
FEMA flood maps are widely regarded as the benchmark for assessing flood risk across the US, but relying on this data set to predict flood, especially flash floods, has limitations. Studies suggest that less than half of the nation’s shoreline and one-third of the nation’s streams have been mapped.
Old Data
FEMA maps are only available as physical paper maps in certain locations, making it difficult to keep them current. According to research by First Street, 75% of FEMA flood maps are older than five years and 11% date back to the 1970s and 1980s. Some city municipalities discourage efforts to update the maps, fearing new assessments will reduce market appeal and slow urban growth.
New Dangers
FEMA maps don’t account for long-term environmental changes or increasingly common urban flooding caused by heavy rainfall—also known as pluvial or flash flooding—which occurs when impervious surfaces like pavement prevent water from properly draining. Only 42% of flood maps currently reflect accurate flood risk projections, according to First Street.
The risk of outdated flood maps is twofold: they create an inaccurate perception of risk and fail to capture the way flood risk is intensifying and changing. With more extreme rainfall events, rising sea levels, and the urbanization of high-risk areas, actual flood risk often exceeds what flood maps indicate.
The Cost of Flooding
According to the Insurance Information Institute, in 2024, the economic losses from flooding in the US was over $10 million dollars and insured losses reached $5 million. The average flood insurance claim in 2024 was nearly $34,000, according to PropertyCasualty360.
With the frequency of flooding events, the resulting property damage can have profound financial implications for homeowners and underscores the significance of reliable solutions to protect homeowners’ investments. Pew Research Center reports that for more than half of Americans, nearly 45% of their wealth resides in their home equity alone.
Flood Coverage Gap
The gap between the number of homeowners exposed to some level of flood risk and the number of homeowners who have flood insurance is vast. To date, only 3.3% of homes in the US and 30% of homes in FEMA-designated high-risk flood zones have flood coverage. Recent studies have shown that compared with FEMA estimates, there are 1.7 times more properties that have substantial flood risk.
Accurate flood zone mapping plays a critical role in protecting a homeowner’s greatest investment. Without accurate prediction tools, homeowners are unable to accurately asses their risk. Lack of access to clear information about risks leads many homeowners to assume they don’t need flood insurance—especially if it is not required by their mortgage lender. Compounding the issue, the common misconception persists that standard homeowners insurance covers flood damage—but it does not.
While flood insurance is not required by federal law, mortgaged properties in high-risk zones and federally funded or backed loans being used to buy, build, or improve a structure in a high-risk zone and often requires flood coverage. Additionally, some communities participate in the NFIP and may have local ordinances or building codes that require flood insurance for certain properties located in flood-prone areas. Even with current requirements, flood insurance take up is not closing the coverage gap fast enough to keep pace with rising flood risk.
How the Private Flood Market Can Close the Gap
Advanced data analysis is helping insurers understand, assess, and price catastrophe risk more accurately—including flood. For a long time, US insurers considered flood exposure too difficult to quantify and price, relegating that responsibility to the NFIP.
But new advances in data, analytics tools, and risk modeling have enabled more accurate flood risk assessments, which have encouraged more private insurers to enter the flood market.
Private flood insurance generally provides greater flexibility and a wider range of coverage options compared to NFIP policies.
For example, SageSure has developed a competitively priced private flood insurance product that leverages the latest advances in flood risk modeling to assess the risk more accurately, especially as it continues to evolve.
Available in Texas, our flood options address a key exposure excluded by most homeowners insurance policies. As an endorsement, this coverage can be added to a homeowners insurance policy and offers blanket, NFIP equivalent, and full limits policies suited for a range of customers.
Backed by leading global reinsurer Swiss Re, SageSure’s flood endorsement can be added to certain homeowners policies and provide important protection against a risk that can happen anywhere.
Help Close the Coverage Gap
Empowering policyholders with information is the most effective way to reduce the coverage gap.
- Educate your policyholders about flood risk and why every home is at risk.
- Communicate what’s covered with a standard homeowners insurance policy and what’s not.
- Give policyholders flood coverage options so they can better protect their home.
For more information about SageSure’s private flood insurance in Texas, reach out to your SageSure sales manager.